What is data?
Data vs. Statistics
Data are raw ingredients from which statistics are created. Statistics are useful when you just need a few numbers to support an argument (ex. In 2003, 98.2% of American households had a television set--from Statistical Abstract of the United States). Statistics are usually presented in tables. Statistical analysis can be performed on data to show relationships among the variables collected. Through secondary data analysis, many different researchers can re-use the same data set for different purposes.
Data Sets, Studies, and Series
In data archives like ICPSR, a data set or study is made up of the raw data file and any related files, usually the codebook and setup files. The codebook is your guide to making sense of the raw data. For survey data, the codebook usually contains the actual questionnaire and the values for the responses to each question. The setup files help will not display properly.
ICPSR uses the term series to describe collections of studies that have been repeated over time. For example, the National Health Interview Survey is conducted annually. In the ICPSR archive, you will find a description of the series that provides an overview. You will also find individual descriptions of each study (i.e. National Health Interview Survey, 2004). The study number in ICPSR refers to the individual survey.
Types of Data
Cross-Sectional describes data that are only collected once.
Time Series study the same variable over time. The National Health Interview Survey is an example of time series data because the questions generally remain the same over time, but the individual respondents vary.
Longitudinal Studies describe surveys that are conducted repeatedly, in which the same group of respondents are surveyed each time. This allows for examining changes over the life course. The Project on Human Development in Chicago Neighborhoods (PHDCN) Series contains a longitudinal component that tracks changes in the lives of individuals over time through interviews.
(Originally from Sue Erickson at Vanderbilt University http://www.library.vanderbilt.edu/central/FindingData.htm)
In regular conversation, both words are used interchangeably. In the world of libraries, academia and research there is an important distinction between data and statistics. Data is the raw information from which statistics are created. Put in the reverse, statistics provide an interpretation and summary of data.
Statistics
If you're looking for a quick number, you want a statistic. A statistic will answer "how much" or "how many". A statistic repeats a pre-defined observation about reality.
Statistics are the results of data analysis. It usually comes in the form of a table or chart. This is what a statistical table looks like:

Source: Surveyanalysis.org
Data
If you want to understand a phenomenon,you want data. Data can be analyzed and interpreted using statistical procedures to answer "why" or "how". Data is used to create new information and knowledge.
Raw data is the direct result of research that was conducted as part of a study or survey. It is a primary source. It usually comes in the form of a digital data set that can be analyzed using software such as Excel, SPSS, SAS, and so on. This is what a data set looks like:
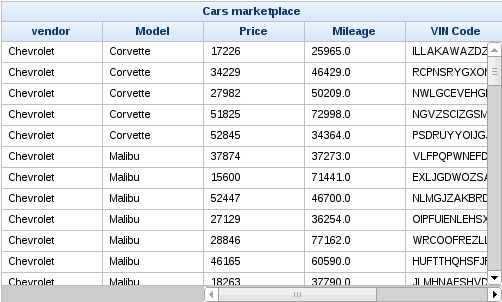
Source: docs.jboss.org